

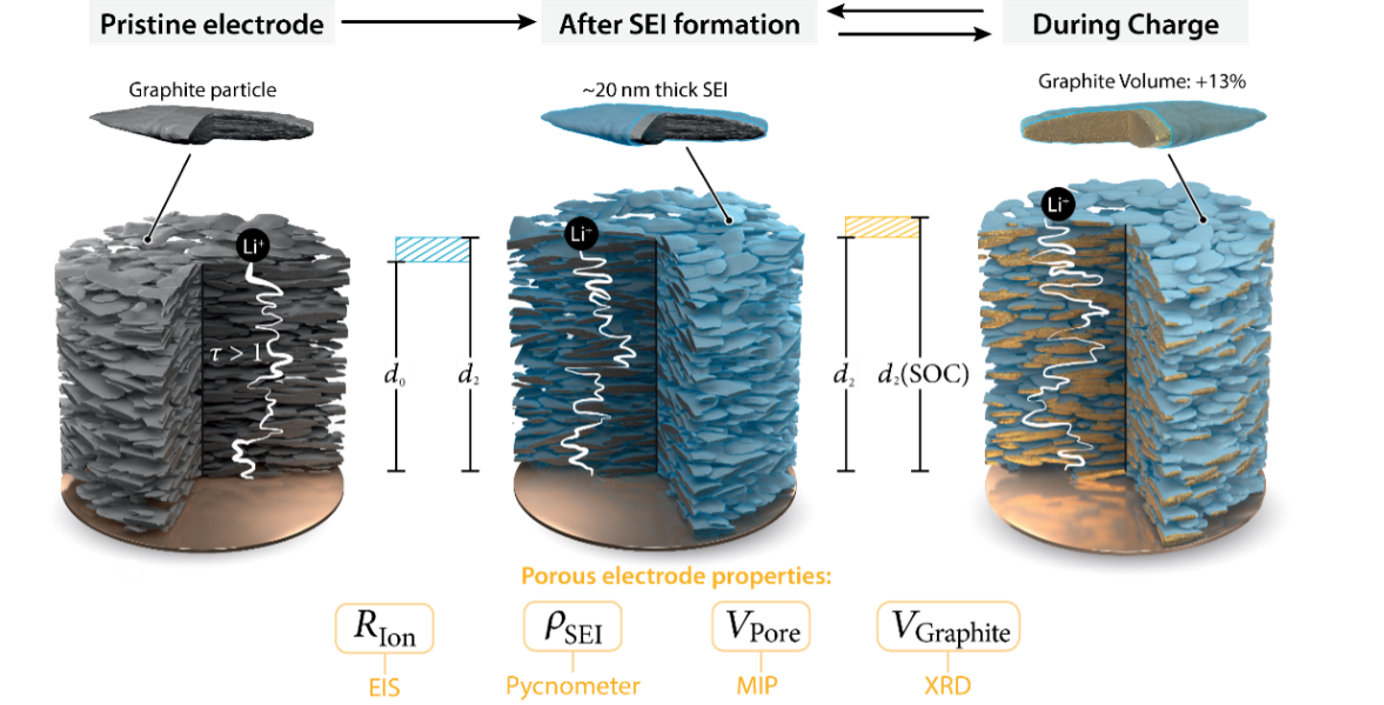
(Click to enlarge)
The Electrochemical Society hosted “Changes in Structure and Ionic Resistance of Lithium-Ion Battery Graphite Electrodes,” a live webinar by Lennart Reuter (Uppsala universitet) and Jonas L. S. Dickmanns (Technische Universität München) on August 5, 2026. A live question and answer session followed. Answers to some of the questions not addressed during the broadcast is below.
Replay the webinar
Why did you specifically measure between 30kHz and 0.1Hz, why not higher frequencies? Was that to avoid the interfacial contributions?
We limited our EIS measurements to the 0.1 Hz–30 kHz range specifically to avoid known high-frequency artifacts of the gold-wire micro-reference electrode, not to suppress interfacial contributions. Above roughly 30 kHz, the electrode-resolved impedance measured via a gold-wire micro-reference becomes distorted because of the large, non-negligible resistance of the thin gold-wire tip itself, which couples into the measurement and produces spurious high-frequency features that do not reflect real electrode behavior. This effect is characterized in detail by Solchenbach et al. (J. Electrochem. Soc. 163, A2265–A2272 [2016]), who first introduced this micro-reference design. To keep our reported impedance spectra free of these instrumental artifacts, we deliberately excluded any data collected above 30 kHz.
I am curious how to use such tortuosity relationships for modelling fast-charging batteries or designing better durable batteries.
Tortuosity and porosity enter Doyle-Fuller-Newman (DFN/P2D) models through the effective transport properties of the porous electrode: the effective electrolyte diffusivity and ionic conductivity are scaled by porosity (ε) and inversely by tortuosity (τ), most commonly via the Bruggeman relation, τ = ε-0.5, though this relation is only a crude approximation and is increasingly replaced by measured or microstructure-resolved values. In most standard implementations, these are treated as fixed, state-independent constants, but this misses the physics of a real graphite electrode.
As shown in the webinar, graphite particles expand during lithiation, which reversibly compresses the pore network and changes both porosity and tortuosity as a function of SOC. Additionally, the SEI growth adds a further, largely irreversible, contribution to this same effect. So, rather than using a single porosity/tortuosity value for the whole DFN simulation, we recommend implementing ε(SOC) and τ(SOC) functions. Ideally, it would derive from your own operando measurements (e.g., dilatometry combined with impedance-based tortuosity extraction) as presented by our work and updating them continuously within the charge/discharge simulation as local lithiation in the graphite anode evolves.
The capacitance measurement gives us the area for Li-ion adsorption; one could argue that this is not the same as the surface area for Li-ion intercalation. How can you be sure what the exact surface area for SEI formation is?
Capacitance measures the area available for Li-ion adsorption, which isn’t strictly the same as the area for intercalation. Graphite exposes three surface types: basal, edge, and defect. Li can only intercalate through edge and defect sites, but we believe SEI-forming reactions occur across all three, since electrolyte reduction doesn’t require intercalation to happen. Edge and defect sites are generally more reactive than the basal plane, though the exact difference isn’t fully resolved.
The relative share of each plane can be quantified via nitrogen-physisorption analysis, using a method developed by Olivier and Winter (J. Power Sources 97–98, 151–155 [2001]). For uncoated artificial graphites like ours, the basal plane typically dominates the total surface area, and our capacitance measurements scale proportionally with BET surface area, supporting capacitance as a reasonable proxy for accessible area.
Since SEI formation isn’t confined to intercalation-active sites, and the basal plane dominates the total area, we treated the capacitance-BET correlation as valid and used the Kr-BET surface area as our estimate of the total SEI-forming area. This is a pragmatic simplification: the exact capacitance-to-area proportionality constant is unknown, since plane-specific capacitance hasn’t been characterized, and we can’t yet attribute SEI-related Li loss to specific planes. That remains an open question for future work. For now, BET area is the most defensible metric we have to normalize our results against.
Is there any study assessing impact of external pressure (through plane) affect porosity of the electrodes at different SOC?
To our knowledge, no study has directly measured how external through-plane pressure affects electrode porosity as a function of state-of-charge experimentally. This remains an open gap in the literature.
Similar calculations do exist for the “zero-dilation” limit (equivalent to an infinitely rigid casing, i.e., effectively infinite external pressure), where porosity changes significantly because intercalation-driven volume expansion is forced entirely into pore compression rather than dimensional change. This is captured by the modeling framework of Garrick, Huang, Srinivasan, and Weidner (J. Electrochem. Soc. 161, E3297–E3301 [2014]), which derives porosity and stress as a function of SOC and the relative compressibility of electrode versus casing.
Consistent with that trend, we measured a larger effect on electrode porosity at 1 MPa external pressure than at the 0.2 MPa condition shown here. We’re currently characterizing this pressure dependence more systematically. Stay tuned for that follow-up work.
Can you go into a bit more detail of how you adapted the El-cell dilatometry cell setup from 1N to spring loaded with 0.2 MPa?
Simon Kücher and co-authors describe this modification (J. Electrochem. Soc. 172, 020537 [2025]). The commercial El-Cell ECD-3-nano dilatometer applies pressure to the working electrode out-of-the-box corresponding to only about 1 N, or roughly 16 kPa relative to the 9 mm spacer area above the electrode. To reach a more application-relevant pressure comparable to typical lab-scale coin cells (0.1–0.2 MPa), the authors integrated a wave spring washer (spring rate 23.08 N/mm) between the stainless-steel membrane and the top cover of the cell. Critically, this modification requires no geometric changes to the commercial setup, so it’s fully reversible between spring-loaded and standard configurations.
How does this analysis differ for different graphite structures? For example, primary/secondary graphites; have you assessed these?
We used flake-type graphite in this study and haven’t tested spherical secondary particles here. For comparison, Spingler et al. (J. Electrochem. Soc. 168, 040515 [2021]) found flake-type graphite (SGL) showed 6.5 percent reversible height change with 7 percent first-cycle irreversible expansion, while spherical MCMB-type graphite (CSCC) showed only 4.9 percent reversible change and slight net contraction rather than irreversible growth. This hints that spherical particles push more volume change into pore compression while showing less irreversible expansion after formation, likely due to lower surface area. However, the two samples also differed in porosity and calendering, so morphology effects can’t be cleanly isolated. This would need a dedicated study at matched porosities.
Does washing the formed electrodes in DMC affect the SEI? Is there a chance that some of the SEI is dissolved in DMC and is lost? Are there any SEM studies that establish what goes on?
We based our washing procedure on previously published protocols for DMC washing prior to postmortem characterization, which is the standard method used to remove excess electrolyte and dissolved LiPF6 without invasive treatment. That said, it’s a fair point that dimethyl carbonate can, in principle, damage the SEI.
To check whether the washing procedure affected our measurements, we formed cells, measured impedance, disassembled and washed the electrodes in DMC, reassembled them, and measured impedance again. The ionic pore resistance only changed minimally between the two measurements (shown in Figure A1 of our Part I publication), which supports that our washing step does not remove enough SEI to meaningfully alter the electrode’s ionic transport properties.
We also compared this against an independent approach, where we compared the Li content of formed and washed electrodes as determined by ICP-OES-based to the Li content on determined by the irreversible lithium loss quantified from SEI formation. This convergence between two independent validation methods supports the validity of the DMC-washing procedure for our system.
Do you think silicon-containing electrodes would show these effects more strongly? Are you investigating this?
Yes, since silicon expands by up to ~300 percent upon full lithiation, compared to graphite’s ~13 percent interlayer spacing change, the effect on electrode thickness and porosity would be substantially more pronounced for silicon-containing electrodes.
We have not measured this directly in our study, since silicon’s volume change is not accessible through the same XRD approach we used for graphite crystalline volume. However, it can be estimated theoretically as demonstrated by Louli et al. at the pouch-cell level, using in situ volume, pressure, and thickness measurements on cells with silicon-composite negative electrodes, and found that cell volume, internal pressure, and thickness all increase non-uniformly during charge and decrease during discharge, driven by the large, reversible expansion of the silicon-containing anode (Louli, Li, Trussler, Fell & Dahn, J. Electrochem. Soc. 164, A2689–A2696 [2017]).
This is consistent with the broader literature: silicon anode design typically relies on high initial porosity (40–60 percent) and engineered carbon host structures to buffer this expansion without excessively sacrificing volumetric capacity. While we haven’t run this analysis for silicon ourselves, the pressure- and porosity-dependent effects we describe for graphite would very likely be amplified, and could become the dominant design constraint, for silicon-containing electrodes.
Learn more about upcoming ECS Webinars and review previous webinar recordings.
Interested in presenting in the ECS Webinar Series? Email your presentation title and abstract to education@electrochem.org for consideration.