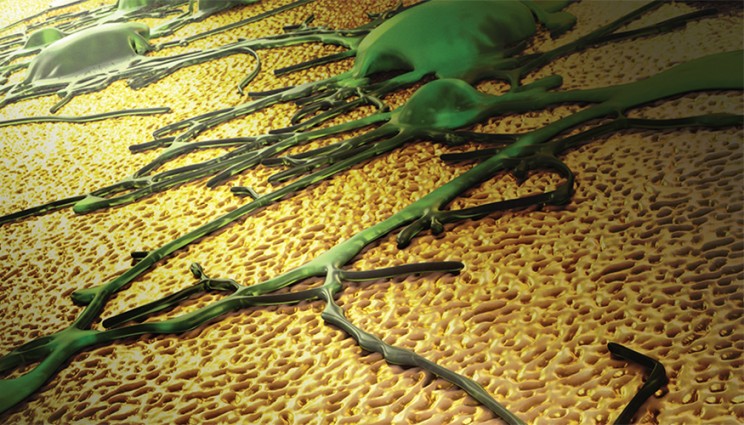
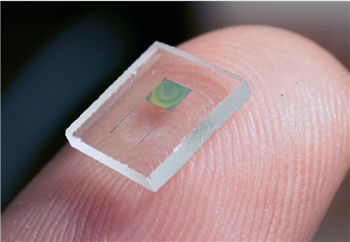
The high-performance 3D microbattery is suitable for large-scale on-chip integration.
Image: Engineering at Illinois
Engineers from the University of Illinois at Urbana-Champaign’s College of Engineering have developed a high-performance 3D microbattery applicable for large-scale on-chip integration with microelectronic devices.
“This 3D microbattery has exceptional performance and scalability, and we think it will be of importance for many applications,” said Paul Braun, professor of materials science and engineering at Illinois.
“Micro-scale devices typically utilize power supplied off-chip because of difficulties in miniaturizing energy storage technologies. A miniaturized high-energy and high-power on-chip battery would be highly desirable for applications including autonomous microscale actuators, distributed wireless sensors and transmitters, monitors, and portable and implantable medical devices.”